
Fig. 1.
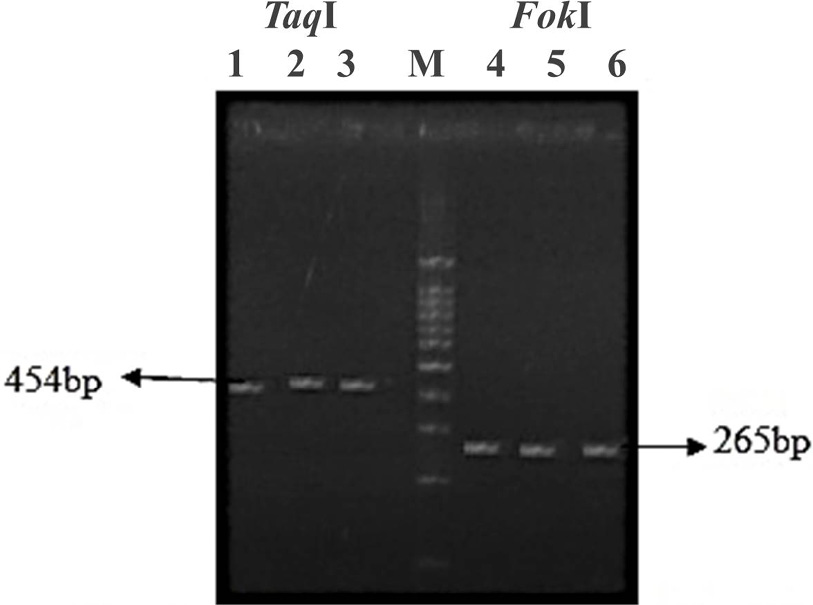
Lanes 1 and 2 shows 454bp bands of patients, Lane 3 shows 454 bp band of control, Lanes 4 and 5 shows 265 bp bands of patients and Lane 6 shows 265 bp band of control. Lane M, marker (100 bp DNA ladder).
Lanes 1 and 2 shows 454bp bands of patients, Lane 3 shows 454 bp band of control, Lanes 4 and 5 shows 265 bp bands of patients and Lane 6 shows 265 bp band of control. Lane M, marker (100 bp DNA ladder).